Is hqdefault a Real 480 × 270 Picture, or the 320 × 180 One Enlarged?
This is the question we left open on the black-bars page, where we could only report that a round-trip test failed to separate the two possibilities. A better test separates them cleanly. Instead of guessing from the file, we built both candidates from each video's own 1280 × 720 original: candidate A is a direct downscale to 480 × 270 — what a genuine render at that size looks like — and candidate B is the original reduced to 320 × 180 and then enlarged back to 480 × 270 — what an enlargement looks like. Then we scored the bar-cropped picture of the real hqdefault against both. On 13 public videos measured on 26 October 2026, the real file matched A on 12 of them (median difference 3.77 against 4.68 of 255), and on 13 of 13 it carried 1.09×–1.61× more edge energy than B. An enlargement cannot invent edges. The 480 × 270 picture is real.
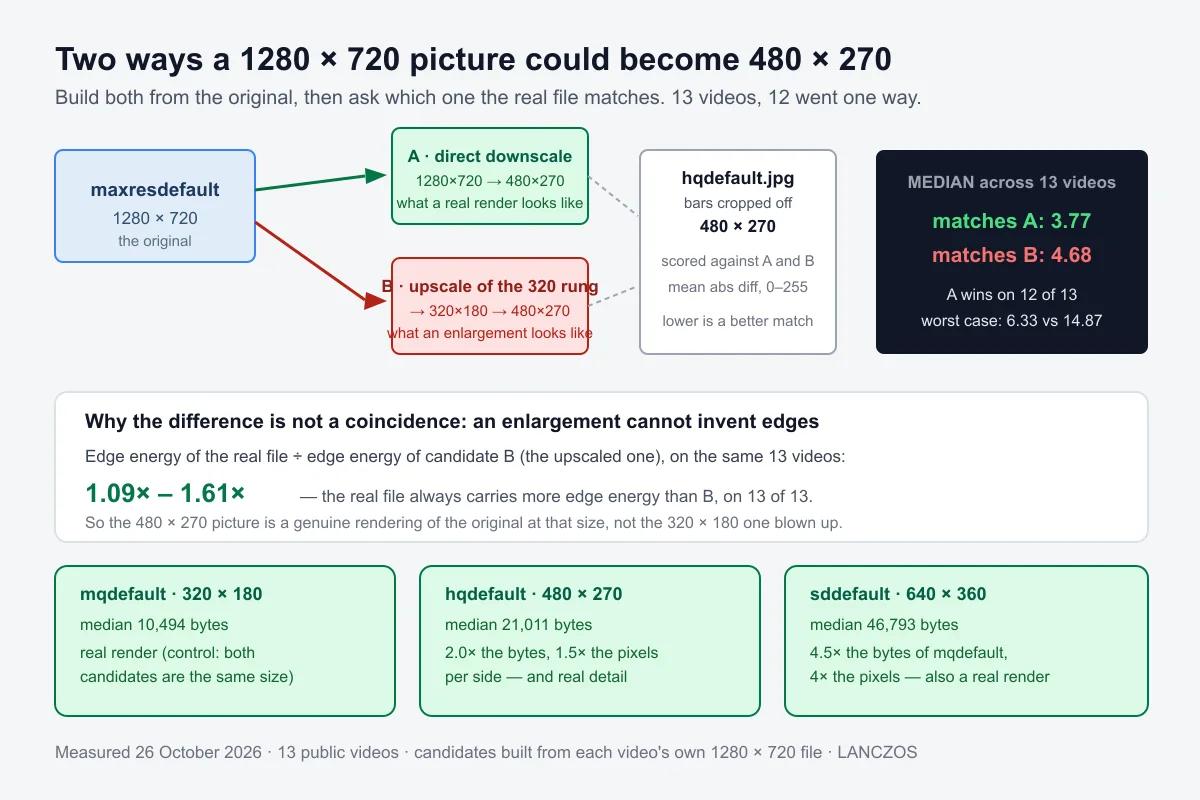
The test, in one paragraph
Download maxresdefault.jpg (1280 × 720), sddefault.jpg (640 × 360 of picture), hqdefault.jpg (480 × 270 of picture) and mqdefault.jpg (320 × 180) for the same video. Crop the black bars off — the arithmetic for that is on the black-bars page. From the 1280 × 720 picture, produce A = resize straight to the target size, and B = resize to 320 × 180 then resize up to the target size. Score the real file against A and against B with mean absolute difference per channel (0–255, lower is a better match). A JPEG render at the smaller size will not be byte-identical to A, because it is encoded separately — but it should be markedly closer to A than to B, and it should retain high-frequency detail that B has lost.
Video by video
Every number below is a measurement on that video's own files. "vs A" means against a direct downscale of its 1280 × 720 original; "vs B" means against the 320 × 180 rung enlarged to the same size. The edge column is the real file's edge energy divided by B's — anything above 1.00 means the real file has detail B does not.
| # | hqdefault picture | hqdefault vs A | hqdefault vs B | Edge ÷ B | sddefault vs A | sddefault vs B |
|---|---|---|---|---|---|---|
| 1 | 480 × 270 | 1.94 | 2.93 | 1.12× | 1.64 | 3.02 |
| 2 | 480 × 270 | 6.33 | 14.87 | 1.45× | 5.17 | 17.23 |
| 3 | 480 × 270 | 3.77 | 4.50 | 1.30× | 3.14 | 4.16 |
| 4 | 480 × 270 | 2.48 | 3.11 | 1.61× | 2.31 | 3.54 |
| 5 | 480 × 270 | 3.80 | 4.68 | 1.33× | 1.81 | 4.23 |
| 6 | 480 × 270 | 4.35 | 5.46 | 1.28× | 1.81 | 4.28 |
| 7 | 480 × 270 | 1.55 | 1.54 | 1.09× | 0.62 | 0.61 |
| 8 | 480 × 270 | 7.97 | 9.42 | 1.56× | 5.00 | 11.82 |
| 9 | 480 × 271 | 11.87 | 13.05 | 1.42× | 4.11 | 10.89 |
| 10 | 480 × 270 | 8.18 | 8.97 | 1.24× | 4.98 | 7.43 |
| 11 | 480 × 270 | 3.66 | 4.78 | 1.26× | 1.77 | 4.30 |
| 12 | 480 × 270 | 3.36 | 4.26 | 1.22× | 1.94 | 3.45 |
| 13 | 480 × 270 | 1.79 | 2.49 | 1.46× | 1.73 | 2.83 |
The gap is not marginal on the detailed pictures. On video 2 the real file is 6.33 from a genuine rendering and 14.87 from an enlargement — 2.3× apart — and sddefault on the same video is 5.17 against 17.23. When a thumbnail carries fine texture, an enlargement is easy to spot. When it does not, the test has nothing to work with, which is exactly what video 7 shows.
The one video where the test says nothing
Video 7 is the exception in every table on this page: 1.55 against 1.54, and 0.62 against 0.61 for sddefault — a tie. It is also by far the flattest picture in the set: its edge energy is 3.26 where the next flattest is 10.23 and the busiest is 60.08. On a picture with almost no fine detail, an enlargement and a genuine render are nearly the same array of pixels, so no difference metric can separate them — and it also happens to be the smallest file of the thirteen (maxresdefault 19,447 bytes). This is a limitation of the measurement, not a claim that this video's file is an upscale: the edge test still puts it slightly on the real side (1.09×), the smallest margin of the thirteen.
What it means when you pick a size
Because all three smaller rungs are genuine renderings, the ladder is a real ladder rather than one picture padded out with enlargements. What you pay for the extra real detail:
| Name | Picture | Median bytes | Bytes vs the 320 rung | Pixels vs the 320 rung | Real render? |
|---|---|---|---|---|---|
mqdefault.jpg | 320 × 180 | 10,494 | 1.0× | 1.0× | yes (control) |
hqdefault.jpg | 480 × 270 | 21,011 | 2.0× | 2.25× | yes, 12/13 |
sddefault.jpg | 640 × 360 | 46,793 | 4.5× | 4.0× | yes, 12/13 |
maxresdefault.jpg / hq720.jpg | 1280 × 720 | 106,809 – 334,114 | 10×+ | 16× | the original |
Read it as value, not as size. Going from 320 × 180 to 480 × 270 doubles the bytes and gives you 2.25× the pixels of real detail — the best trade on the ladder. Going on to 640 × 360 costs another 2.2× the bytes for 1.78× more pixels. That is worth it only if you are going to display the picture at more than about 640 pixels wide, which in practice means a full-width banner or a desktop wallpaper, not a card in a feed.
Why the control matters
mqdefault is 320 × 180, which is the size candidate B passes through, so for that one name A and B are the same object and the two numbers must be identical. They are, to the digit, on all 13 videos (2.77 and 2.77 on the first, for example). That is the checksum for the whole method: if the two candidates had been built wrongly, this row would not agree with itself.
What the three biggest thumbnail pages say about this
Both competitor sitemaps in full plus vidiq's thumbnail category, scripts and styles stripped: 24 HTML files, 36,568 words.
| Term | Hits | What is there |
|---|---|---|
hqdefault | 0 | — |
sddefault | 0 | — |
mqdefault | 0 | — |
maxresdefault | 0 | — |
upscal | 0 | — |
enlarge | 0 | — |
sharpen | 0 | — |
resampl | 0 | — |
downscal | 1 | vidiq, about a video being downscaled for a test, not about thumbnails |
blurr | 6 | all six are upload advice — "use HD / 1280 × 720 or it will look blurry" — never about a served file |
Twenty-four pages about YouTube thumbnails, 36,568 words, and not one of them names a single file, let alone asks whether the small ones are real. The six mentions of blurriness are all instructions to the person uploading. Nobody checks what comes back down.
What we did not measure
- Other resampling kernels. Every candidate here was built with Lanczos. A different kernel would shift the absolute numbers slightly, though not the ordering — the edge-energy test does not depend on the kernel at all.
- How YouTube actually renders these files. We can show the real file behaves like a genuine render at that size. We cannot see the encoder, its kernel, or its quality setting; nothing here is a claim about YouTube's pipeline.
- Video 7's verdict. Reported as a tie, not resolved. With edge energy that low, no comparison of this kind can decide.
- Vertical and 4:3 source thumbnails. All 13 videos are 16:9 uploads. The bars on these names are covered on the black-bars page; what a 9:16 upload produces was not tested.
- Whether the 1280 × 720 file we used as a reference is itself the highest-quality copy. Where
maxresdefaultandhq720differ, they differ in content, not just quality — measured on the variants page.
Questions people actually ask
"Is hqdefault just a stretched small thumbnail?"
No. On 12 of 13 videos it is measurably closer to a genuine 480 × 270 rendering of the original than to an enlargement of the 320 × 180 file, and it retains 1.09×–1.61× more edge energy than that enlargement on all 13.
"Then why does my hqdefault look soft compared with a 1280 × 720 download?"
Because it is 480 × 270 of real picture — a quarter of the pixels, not a copy. It is a true rendering at a smaller size, which is a different thing from a blurry one.
"Is sddefault worth 4.5× the bytes of mqdefault?"
It is a real 640 × 360 rendering, so the detail is there. Whether it is worth it depends on display size: at card size in a feed you will not see it, at full width you will.
"Can I make a bigger picture by upscaling hqdefault myself?"
You can, and it will look the way upscaling looks — you would be doing to the file exactly what candidate B does in this test, which scored 2.3× worse than a genuine rendering on the best case here.
"How can 12 out of 13 be enough to say 'real'?"
Because the thirteenth is not evidence against it — it is a picture too flat to test, with the flattest edge energy of the thirteen by a factor of three, and its edge score still lands on the real side. Both tests are reported per video above, so you can disagree with the summary and still read the data.
Measured on 26 October 2026: 13 public videos, four names each, candidates A and B built from each video's own maxresdefault with Lanczos resampling in both directions, black bars cropped by the row-brightness rule described on the black-bars page, and differences scored as mean absolute difference per channel (0–255). Edge energy is the mean of a Laplacian-filtered greyscale copy. No video ID, channel or thumbnail image appears on this page. Nothing here is an estimate, and the one result the method cannot decide is shown as a tie rather than rounded into the conclusion.